Performance Tester
Overview
The VBE Tools Performance Tester is designed to help you find
any performance bottlenecks in your VBA code. It does that by adding a line of code at the start and end of every
procedure that tells the addin when each one starts and stops. When your code is run, the addin tracks the full call
stack, measuring how many times each procedure is called and the time spent in each.
- Every procedure is given a unique Id, usually the Project.Module.Procedure names
- Every procedure gets a PerfTestProcStart and PerfTestProcEnd call, passing that Id
- The entry-point procedure(s) are given a PerfTestStartMonitoring and PerfTestStopMonitoring call
- When run, all the calls are counted and timed
- When finished, the results are available through code and can be shown in the Results Window, copied to the clipboard and/or written to a file
Options
The Performance Tester Options screen controls how the monitoring calls are added to your code and therefore what
monitoring is performed. There are quite a few choices to finely-control its behaviour:
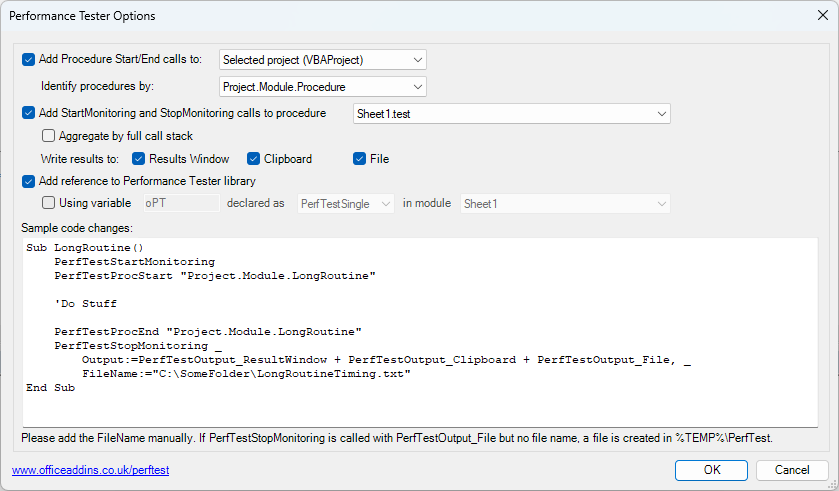
Add Procedure Start/End calls sets whether to add the PerfTestProcStart and PerfTestProcEnd calls, and if so, which
procedures should get them - the current project, module or procedure.
Identify procedures sets whether to use the project or module names to uniquely identify the procedures.
Add Start Monitoring and Stop Monitoring calls sets whether to add PerfTestStartMonitoring and PerfTestStopMonitoring
calls in the code and the entry point procedure to add them to.
Aggregate by full call stack can be used to distinguish when a common procedure is called from many places and may have
quite different performance depending on where it's called from. If checked, the performance tester will keep a separate count
and duration for each way the procedures are invoked. It adds the True parameter to PerfTestStartMonitoring.
The Write results to check boxes add a parameter to PerfTestStopMonitoring, telling the code where to write the results to.
See below for more information.
Add reference to Performance Tester library adds a project reference to the PerfTest library (shown as "VBE Tools Addin
for the Visual Basic Editor" in Tools > References), allowing the performance
tester code to be invoked as a COM object. If this is unticked, the code is invoked
using the COMAddin's Object. It is unlikely to ever need to be un-ticked, as going through the COMAddin object is much slower.
The PerfTest calls are all global, so do not need a variable to be defined in normal usage. Some people prefer to use an Object.Method syntax,
so ticking the using variable option will create the calls in that style, with the variable name provided.
declared as allows you to choose the way in which multiple modules and/or projects interact. When declared as PerfTestSingle,
each variable in each module or project is independent and tracks only the procedures where it's used. When declared as
PerfTestGlobal, all such variables in all modules and all projects share and collaborate in a single testing process (including when variables aren't used).
In most cases, the choice won't make a difference, but if your code runs across multiple projects (such as when
using Application.Run or events to invoke code in other projects), you will need to use PerfTestGlobal or not use the variables syntax.
in module allows you to state which module in the project to declare the variable in. This would usually be done once in a standard module
in the project, with the same variable used for all other modules.
The sample code window shows typical code changes that will result from your choices.
Results
When your code runs, the PerfTest object maintains a list of all the procedures called and the time spent in each. When PerfTestStopMonitoring
is called, the results are available as the PerfTestResultHeader and PerfTestResults properties of the global variable. PerfTestResults gives
an array of PerfTestResult objects. All numeric results are in millseconds. You could, therefore list out all the procedures that took longer than
ten seconds:
Sub TestSomething()
PerfTestStartMonitoring
PerfTestProcStart "VBAProject.ThisWorkbook.TestSomething"
For i = 1 To 10000
DoSomething
Next
PerfTestProcEnd "VBAProject.ThisWorkbook.TestSomething"
PerfTestStopMonitoring PerfTestOutput_None
Debug.Print PerfTestResultHeader
For Each var In PerfTestResults
If var.TotalMilliseconds > 10000 Then
Debug.Print var.AsString
End If
Next
End Sub
The PerfTestStopMonitoring optional parameters control what else is done:
The OutputLocation parameter is a bit-wise enum (so can be added to produce multiple outputs), with choices:
- PerfTestOutput_None to not write the results anywhere.
- PerfTestOutput_ResultWindow to write the results to the dockable Performance Tester Results Window
- PerfTestOutput_Clipboard to write the results to the clipboard (e.g. to then be pasted into an Excel sheet for analysis)
- PerfTestOutput_File to write the results to a file
The FileName parameter can be used to provide the file name to save the results to. If Output_File is set, but no file name is provided,
the results are saved under your temp folder.
If PerfTestOutput_ResultWindow is used, click on View > Performance Tester Results Window to see the results of the latest run:
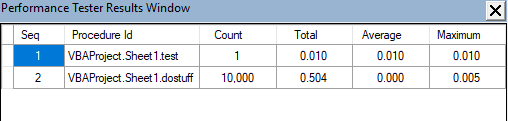
The times in the window are shown in seconds, with minutes and hours added for particularly long-running routines. The window can be docked
alongside the Locals, Watch and Immediate windows. Each column can be sorted by clicking on the header.
Tidying Up
Once you've finishing analysing the performance, use the Remove code options to remove all PerfTest calls from the module or project. If you have
written some of your own code using those objects, that code will need to be removed manually.